
Are you looking to spice up your WordPress site with stunning visuals that captivate your audience? You’re in the right place! Charts and graphs are not just pretty pictures; they’re powerful tools that help convey complex data in a way that’s easy to understand and visually appealing. Whether you’re sharing sales figures, survey results, or any kind of statistical information, the right chart can make all the difference in engaging your readers and enhancing your content.
In this article, we’ll explore the 11 best WordPress chart plugins that will allow you to create eye-catching charts with ease. From user-friendly options for beginners to more advanced tools for seasoned pros, we’ve got you covered. Plus, we’ll walk you through the steps to create beautiful charts that not only look good but also tell a compelling story. So, let’s dive in and unlock the potential of your data with these fantastic plugins! Your audience will thank you!
Understanding the Importance of Charts for Your WordPress Site
Charts play a pivotal role in how information is conveyed on your WordPress site. They transform complex data into visually appealing graphics that are easier for your audience to digest. In a world where attention spans are fleeting, the ability to present information clearly and engagingly can make a significant difference in user experience and retention.
One of the most compelling reasons to incorporate charts is their effectiveness in storytelling. A well-designed chart can illustrate trends, comparisons, and relationships within your data, allowing visitors to grasp insights at a glance. This is particularly important for industries that rely heavily on statistics, such as finance, marketing, and healthcare. When your audience can quickly understand the key messages through visual representation, they are more likely to engage with your content and share it with others.
Moreover, charts enhance the aesthetic appeal of your site. A beautifully crafted graph or diagram can break up large chunks of text, making your pages more visually engaging. This not only keeps readers on your site longer but also encourages them to explore more of your content. As the saying goes, “A picture is worth a thousand words,” and in the digital landscape, that couldn’t be truer.
When considering which plugins to use for creating charts, look for those that offer:
- User-friendly interfaces: You don’t want to spend hours learning how to use a tool.
- Customization options: The ability to tailor charts to fit your website’s branding is essential.
- Responsive designs: Ensure your charts look great on all devices.
- Data import functionalities: Plugins that allow easy data uploads can save you time and effort.
Here’s a simple table showing some popular WordPress chart plugins, highlighting their key features:
| Plugin Name | Key Feature | Best For |
|---|---|---|
| Visualizer | Interactive charts | General use |
| wpDataTables | Data handling and analytics | Large datasets |
| Chart.js | Customization | Developers |
| TablePress | Data tables | Data presentation |
charts can significantly boost your site’s SEO potential. Engaging visuals encourage backlinks and social shares, which can drive traffic to your site. Plus, search engines favor content that keeps users on the page longer, and interactive charts can help achieve that. By embracing charts, you’re not just enhancing your content; you’re also investing in your site’s overall success.
Choosing the Right Chart Plugin for Your Needs
When it comes to displaying data effectively on your WordPress site, selecting the right chart plugin can make all the difference. With so many options available, it’s essential to understand your specific requirements before making a choice. Here are some factors to consider:
- Type of Charts Needed: Consider what types of charts you will be using. Do you need bar graphs, line charts, pie charts, or something more complex? Some plugins specialize in specific types, while others offer a broad range.
- Ease of Use: Look for plugins with a user-friendly interface. A steep learning curve can deter you from utilizing the tool effectively. An intuitive drag-and-drop feature can simplify the creation process.
- Customization Options: The ability to customize colors, fonts, and styles can help ensure that your charts align with your branding. Some plugins provide extensive customization features, while others offer limited options.
- Responsiveness: With an increasing number of users accessing websites via mobile devices, ensure your chosen plugin renders charts correctly on different screen sizes.
- Support and Updates: Opt for plugins that receive regular updates and offer reliable customer support. This can save you time and frustration in the long run.
Another critical aspect is integration. If you plan to use your charts in conjunction with other tools or platforms, check if the plugin supports integration with those systems. For example, if you’re using Google Sheets, finding a plugin that supports data import from there can streamline your workflow.
To help you make an informed decision, consider creating a comparison table. Here’s an example of how you might evaluate a few options:
| Plugin | Chart Types | Customizable | Ease of Use |
|---|---|---|---|
| Chart.js | Bar, Line, Pie | Yes | Moderate |
| Visualizer | All Types | Yes | Easy |
| WPDataTables | Custom Tables, Charts | Extensive | Easy |
| Charts | Bar, Line, Area | Limited | Very Easy |
Ultimately, the perfect chart plugin for you balances functionality, ease of use, and aesthetics. Consider running a test with a few plugins to see which aligns best with your workflow and visual preferences. Once you’ve chosen the right tool, you can create stunning charts that enhance the user experience on your site, making your data not just informative but also visually appealing.
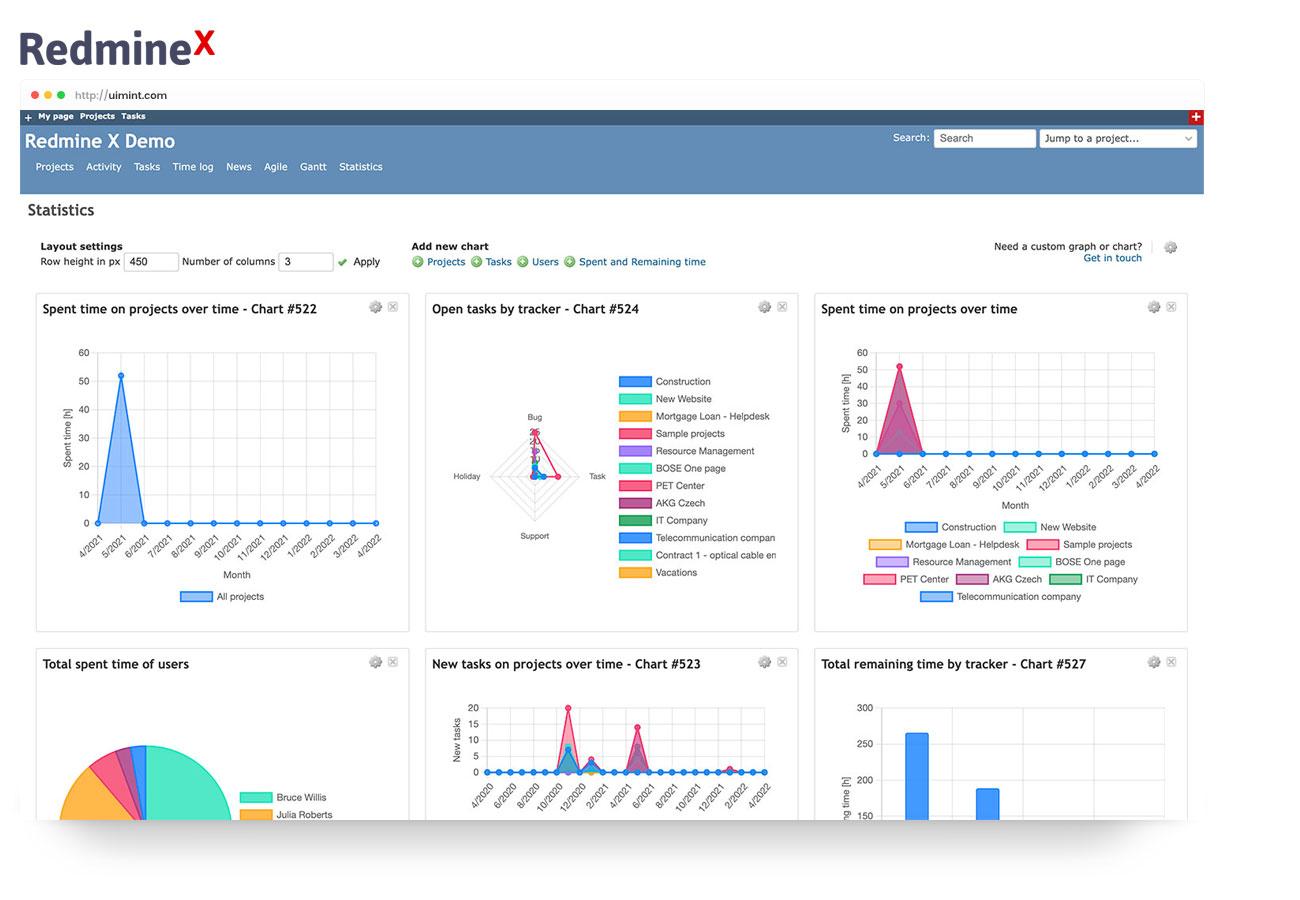
A Closer Look at the Top WordPress Chart Plugins
When it comes to visualizing data on your WordPress site, the right chart plugin can make all the difference. Whether you’re looking to present complex data in a digestible format or want to enhance user engagement with visually appealing graphics, there are several outstanding options to consider. Let’s explore some of the top WordPress chart plugins that can elevate your content and captivate your audience.
1. Visualizer is a user-friendly plugin that allows you to create responsive charts and graphs effortlessly. With its intuitive interface, you can import data from Google Sheets, Excel, or CSV files and transform it into stunning visuals. The range of chart types, including pie charts, bar graphs, and line charts, ensures that you can find the perfect representation for your data.
2. wpDataTables takes data visualization to a whole new level. This powerful plugin not only creates beautiful charts but also allows you to manage large datasets effectively. With features like front-end editing and filtering, users can interact with the data, making it a versatile tool for anyone who relies on dynamic content. Plus, its compatibility with Google Charts and Highcharts means you have access to an extensive library of chart types.
3. Chart.js brings simplicity and elegance to your charts. This lightweight library is easy to integrate into WordPress through various plugins. It offers a multitude of chart options, and the responsive design ensures they look great on any device. Whether you’re a developer looking for customization options or a site owner needing quick solutions, Chart.js delivers both.
| Plugin Name | Key Features | Best For |
|---|---|---|
| Visualizer | Responsive charts, Google Sheets integration | Beginners |
| wpDataTables | Large datasets, front-end editing | Data-heavy sites |
| Chart.js | Lightweight, customizable | Developers |
4. Elementor Charts is perfect for those using the Elementor page builder. It seamlessly integrates with your designs, allowing you to add various charts directly into your pages. The drag-and-drop functionality makes it simple to customize your visuals, ensuring they align with your site’s aesthetic. This plugin is great for those who want to maintain design consistency while presenting data.
5. Ultimate Charts combines ease of use with functionality, offering a straightforward setup and a selection of visually appealing chart options. This plugin is ideal for bloggers and small businesses looking to convey data in an engaging manner without the need for extensive technical knowledge. The customization options ensure your charts fit your brand’s look and feel.
How to Create Stunning Charts with Each Plugin
Creating stunning charts can transform your data presentations from mundane to magnificent. With the right plugins, you can easily visualize complex information, making it more digestible and engaging for your audience. Let’s dive into how to use some of the best WordPress chart plugins to create eye-catching visuals.
1. Chart.js: This popular JavaScript library integrates seamlessly with WordPress. To get started, simply install the Chart.js plugin and follow these steps:
- Navigate to your plugin settings and create a new chart.
- Choose the type of chart you want to create (line, bar, doughnut, etc.).
- Input your data directly or link to an external source.
- Customize your chart with personalized colors and labels.
With its clean aesthetic and responsive designs, your charts will look impeccable on any device.
2. WP Charts: This user-friendly plugin is perfect for beginners. To craft beautiful charts:
- Go to the WP Charts dashboard and select ‘Add New Chart’.
- Fill in the data fields with your statistics.
- Choose from a variety of chart templates.
- Preview your chart before embedding it in your posts or pages.
WP Charts also offers a range of customization options, so you can align the colors with your website’s branding.
| Chart Type | Ideal For | Customization Options |
|---|---|---|
| Line Chart | Trends over time | Color, labels, tooltips |
| Bar Chart | Comparative data | Bar colors, legends |
| Doughnut Chart | Proportional data | Slice colors, labels |
3. Visualizer: This plugin allows for both simple and complex chart creations. To get started:
- Install the Visualizer plugin and select the ‘Add Chart’ option.
- Choose your chart type and upload your data as a CSV file for quick import.
- Customize with various themes, colors, and fonts to match your site’s style.
Additionally, Visualizer allows you to create interactive charts that your visitors can engage with, enhancing their overall experience.
Whether you opt for Chart.js, WP Charts, or Visualizer, each plugin offers unique features that cater to different needs. With a little creativity and the right tools, you can make your data not only informative but also visually appealing. Happy charting!
Integrating Charts Seamlessly into Your Content
Incorporating charts into your content is not just about showcasing data; it’s about enhancing the overall reader experience. By using visually appealing charts, you can transform complex information into easily digestible insights. With the right plugins, this process becomes seamless, allowing you to focus on creating engaging narratives rather than getting bogged down by technicalities.
One of the most significant advantages of using chart plugins in WordPress is the variety of chart types available. Whether you need a simple bar chart, a complex scatter plot, or even interactive pie charts, modern plugins offer a range of options that cater to different data visualization needs. Here are some popular chart types you might consider:
- Bar Charts – Great for comparing quantities across categories.
- Line Charts – Perfect for showing trends over time.
- Pie Charts – Useful for illustrating proportions of a whole.
- Area Charts – Ideal for displaying cumulative totals over time.
Moreover, many of these plugins come with built-in customization options, allowing you to match the charts to your website’s branding. You can tweak colors, fonts, and sizes to ensure that every element aligns with your overall design aesthetic. This level of customization not only makes your charts look professional but also reinforces your brand identity.
Incorporating charts effectively involves more than just data representation. It’s crucial to place them strategically within your content. Here are some tips for optimal placement:
- Position charts near relevant text to provide context.
- Use charts as visual breaks in long paragraphs to maintain reader interest.
- Consider responsiveness to ensure charts look good on all devices.
Additionally, don’t overlook the importance of accessibility. Ensure that your charts are easy to understand for all users, including those who may rely on screen readers. Providing alternative text descriptions or data tables can help make your content more inclusive.
| Plugin Name | Key Feature | Best For |
|---|---|---|
| Chart.js | Highly customizable | Developers |
| Visualizer | User-friendly interface | Beginners |
| WP DataTables | Data handling | Complex datasets |
Ultimately, the goal of integrating charts into your WordPress content is to tell a story with your data. When done correctly, charts can elevate your content, making your articles more engaging and informative. So go ahead, explore the plugins available, and start creating stunning visual representations of your data that resonate with your audience!

Tips for Customizing Your Charts for Maximum Impact
Customizing your charts effectively can significantly enhance your data presentation and engagement with your audience. Here are some essential tips to make your charts stand out:
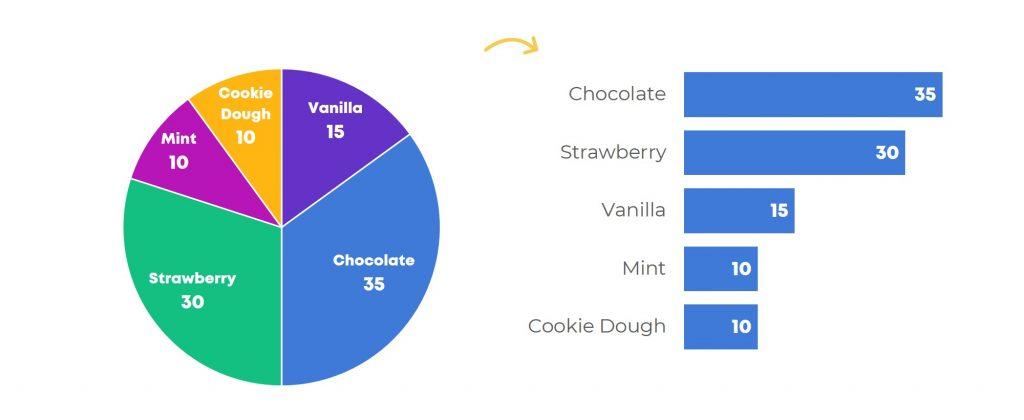
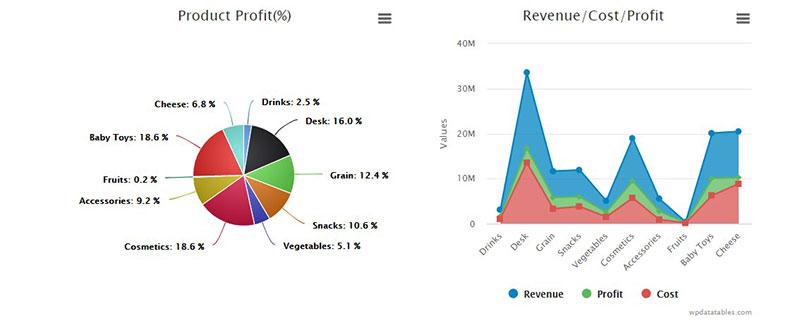
- Choose the Right Type of Chart: Depending on the data you’re presenting, select the chart type that best showcases your information. For example, use pie charts for parts of a whole and line charts for trends over time.
- Incorporate Your Brand Colors: Use your brand’s color palette to create a cohesive look. This not only reinforces brand identity but also makes your charts more visually appealing.
- Keep It Simple: Avoid cluttering your charts with excessive information. Focus on the key data points that tell the story effectively without overwhelming your audience.
- Add Annotations: Use callouts or annotations to highlight significant data points or trends. This makes it easier for viewers to understand the relevance of the information presented.
Another effective strategy is to leverage interactivity. Many WordPress chart plugins support interactive features that allow users to hover over or click on elements for more information. This can make your charts not only more engaging but also more informative.
Consider including a responsive design in your charts. With more users accessing content on mobile devices, ensuring your charts are mobile-friendly will enhance the user experience. Test your charts on various devices to see how they adapt to different screen sizes.
| Chart Type | Best For | Key Plugin |
|---|---|---|
| Bar Chart | Comparing Data | WP Charts |
| Line Chart | Showing Trends | Visualizer |
| Pie Chart | Proportions | Chart.js |
| Scatter Plot | Correlation | Data Tables |
Lastly, don’t forget to test the accessibility of your charts. Ensure that your color choices are distinguishable for those with color blindness and that any text included in the charts is easy to read. Accessible charts not only reach a wider audience but also show that you care about providing quality information to everyone.
Enhancing User Engagement with Interactive Charts
Interactive charts are a powerful way to captivate your audience and boost user engagement on your WordPress site. Unlike static images, these dynamic visuals allow users to interact with the data, making it more relatable and easier to understand. By utilizing interactive charts, you create a more immersive experience, prompting visitors to spend more time on your site and explore more of your content.
One of the best ways to enhance user engagement is by allowing users to manipulate the data themselves. This could mean the ability to filter results or hover over data points to reveal additional information. Here’s how interactive charts can elevate your user experience:
- Customization: Users appreciate having control over what they see. Interactive charts allow them to tailor the data to their preferences, enhancing relevance.
- Data Exploration: Providing tools for users to explore the data fosters a sense of discovery, keeping them engaged longer.
- Visual Appeal: Aesthetically pleasing charts can grab attention, making your content more attractive and shareable.
Additionally, incorporating storytelling elements into your charts can draw your audience in even deeper. By presenting data in a narrative format, you guide users through the information in a way that’s both informative and entertaining. Think about using:
- Color Schemes: Use colors strategically to highlight key data points or trends.
- Animations: Subtle animations can help bring your charts to life, making them more engaging.
- Contextual Information: Provide insights or anecdotes alongside your charts to give the data more meaning.
To illustrate the impact of interactive charts, consider the following comparison of engagement metrics:
| Chart Type | Average Time Spent | Engagement Rate |
|---|---|---|
| Static Charts | 1 minute | 20% |
| Interactive Charts | 4 minutes | 50% |
As evidenced by the data, interactive charts not only capture attention but also retain it significantly longer. To implement these engaging tools on your WordPress site, consider using chart plugins that offer robust features and ease of use. Explore options that allow for customization, interaction, and integration with your existing themes to ensure a seamless user experience. By investing in interactive charts, you’ll not only enhance the visual appeal of your site but also foster a community of engaged users eager to interact with your content.
Troubleshooting Common Issues with Chart Plugins
Using chart plugins can significantly enhance your WordPress site, but like any technology, they can sometimes run into hiccups. Here are some common issues you might face when using chart plugins, along with effective troubleshooting tips to get everything back on track.
1. Charts Not Displaying Correctly
If your charts aren’t appearing as expected, it might be due to:
- Plugin Conflicts: Deactivate all plugins except your chart plugin to identify if there’s a conflict.
- JavaScript Errors: Check for console errors in your browser’s developer tools. These can often interfere with chart rendering.
- Outdated Plugin or Theme: Ensure both your chart plugin and WordPress theme are up to date to avoid compatibility issues.
2. Data Not Loading
Sometimes, the data you input might not be loading into your charts. Here’s what you can do:
- Check Data Format: Make sure your data is formatted correctly according to the plugin’s requirements. A single incorrect character can prevent data from displaying.
- Clear Cache: If you’re using a caching plugin, clear the cache to see the most recent changes.
- Check Shortcodes: Ensure that your shortcode is correctly placed and formatted in the page or post.
3. Styling Issues
If your charts look off and don’t match your site’s aesthetic, consider the following:
- CSS Conflicts: Inspect your site’s CSS and see if any styles are overriding the default styles of the chart plugin. Adding custom CSS can help you refine the appearance.
- Plugin Settings: Dive into the plugin settings. Most chart plugins offer customizable options for colors, fonts, and sizes.
4. Slow Loading Times
Charts that take too long to load can frustrate visitors. To speed things up:
- Reduce Data Size: If you’re using a large dataset, try to simplify it or limit the amount of data displayed.
- Optimize Images: If your charts include images, ensure they are optimized for web use.
In case you continue to experience problems, consider reaching out to the plugin’s support forum. The community can be a great resource, and often, developers are quick to resolve issues or offer workarounds.
Real-Life Examples of Effective Chart Usage
Charts are more than just data visuals; they tell stories and illustrate trends in ways that words alone cannot. Let’s look at some real-life examples where effective chart usage made a significant impact.
One compelling instance is a non-profit organization that aimed to raise awareness for climate change. They utilized a combination of bar and line charts to showcase the rise in global temperatures over the past century. By juxtaposing this data with visual representations of melting ice caps and rising sea levels, they not only conveyed the urgency of the issue but also inspired action among their audience. The clear, visual storytelling helped them increase donations by 40% during their campaign.
In the business sector, a tech startup used pie charts to illustrate their market share compared to competitors. By presenting this information in a visually engaging way, they were able to attract investors during a pitch meeting. The pie charts highlighted their growth potential and market positioning clearly, making a complex subject digestible. Investors walked away with a better understanding of their business dynamics, leading to successful funding.
Education platforms have also harnessed the power of charts. For instance, a popular e-learning website implemented line graphs to track student progress over time. This visual representation allowed students and educators to identify learning patterns and areas that needed improvement. The platform saw a 30% increase in course completions as the insights derived from the charts motivated students to stay engaged with their studies.
| Organization Type | Chart Type Used | Impact |
|---|---|---|
| Non-Profit | Bar and Line Charts | 40% Increase in Donations |
| Startup | Pie Charts | Successful Investor Funding |
| Education | Line Graphs | 30% Increase in Course Completions |
These examples underscore the versatility and power of charts in various sectors. Whether in advocacy, business, or education, the right chart can transform data into actionable insights. If you’re not utilizing charts effectively, it’s time to rethink your strategy. Beautiful and informative charts can elevate your content, engage your audience, and turn raw data into compelling narratives.
Final Thoughts on Elevating Your WordPress Experience with Charts
Integrating charts into your WordPress site can truly transform the way you present data and engage your audience. By utilizing the right plugins, you not only enhance the visual appeal of your content but also make complex information digestible and captivating. With a plethora of options available, choosing the best chart plugin can be daunting, yet the rewards are well worth the effort. Here’s why investing in quality chart plugins is crucial for your WordPress experience.
First and foremost, visual storytelling is a powerful tool. Humans are naturally drawn to visuals, and incorporating charts helps to illustrate trends, comparisons, and insights more effectively than text alone. With the right plugin, you can create stunning pie charts, bar graphs, and line charts that not only clarify your message but also keep your audience engaged. Think about your site’s goals—whether it’s to inform, persuade, or entertain—and let charts amplify that message.
Moreover, many chart plugins come equipped with user-friendly interfaces and customization options. This means you don’t need to be a coding wizard to create visually appealing charts. Most plugins enable simple drag-and-drop functionality, allowing you to personalize colors, styles, and data inputs effortlessly. This customization ensures that your charts align seamlessly with your site’s aesthetic and branding, enhancing the overall user experience.
Another essential benefit is data interactivity. Interactive charts allow users to hover over data points or click on segments for more detailed information. This dynamic interaction not only keeps visitors on your page longer but also encourages deeper engagement with your content. Imagine presenting your website visitors with a chart that they can manipulate to view different data sets—this not only enriches their experience but also helps establish you as a credible source of information.
To give you a clearer picture, consider the following table showcasing some popular WordPress chart plugins and their standout features:
| Plugin Name | Main Features | Best For |
|---|---|---|
| Chart.js | Interactive charts, simple API | Developers and designers |
| WP Data Tables | Responsive tables, filters | Data-heavy websites |
| Visualizer | User-friendly, Google Sheets integration | Content creators |
Lastly, let’s not overlook the importance of data accuracy and credibility. By presenting reliable and well-organized data in chart form, you bolster your content’s authority. This is particularly important in competitive niches where establishing trust can make all the difference. A well-crafted chart can serve as a visual endorsement of your claims, making your arguments more persuasive and trustworthy.
elevating your WordPress experience with charts is not just about aesthetics—it’s about creating a richer, more engaging, and informative experience for your visitors. By leveraging the best chart plugins available, you can transform mundane data into vibrant visuals that captivate your audience and enhance your content’s effectiveness. So go ahead, explore the options, and watch your data come to life!
Frequently Asked Questions (FAQ)
Q: Why should I use chart plugins for my WordPress site?
A: Great question! Using chart plugins can significantly enhance your content by visually representing data. Charts make complex information easier to digest, helping your audience grasp insights quickly. Plus, well-designed charts can improve user engagement and increase the shareability of your posts. It’s all about making your data work for you!
Q: What are the benefits of using the best chart plugins for WordPress?
A: The top chart plugins come packed with features that streamline your workflow. They often offer customizable designs, real-time data updates, and support for various chart types like bar, line, and pie charts. With the best plugins, you can create stunning visuals that align with your site’s branding, making your presentations not just informative but also attractive!
Q: Are these chart plugins easy to use for beginners?
A: Absolutely! Most of the best chart plugins are designed with user-friendliness in mind. They usually come with intuitive interfaces and drag-and-drop features, making it simple for even those without a technical background to create beautiful charts. Plus, many offer tutorials and support to help you get started quickly!
Q: Can I use these chart plugins for real-time data?
A: Yes! Many top-tier chart plugins allow you to connect your charts to real-time data sources, like Google Sheets or APIs. This means your charts can automatically update as your data changes, keeping your content fresh and relevant without requiring you to manually input new information.
Q: Will using a chart plugin slow down my website?
A: Performance is always a concern, but many of the best chart plugins are optimized to minimize load times. It’s crucial to choose reputable plugins and regularly check your site’s speed. Additionally, using caching plugins can help improve performance further, ensuring your charts look great without bogging down your site.
Q: How do I choose the best chart plugin for my needs?
A: Start by assessing your specific needs. Do you need a simple bar chart or more complex data visualization options? Consider factors like ease of use, customization options, and whether you need real-time data integration. Reading user reviews and comparing features can also help you make an informed choice.
Q: Can I customize the appearance of the charts I create?
A: Definitely! Most top WordPress chart plugins offer extensive customization options. You can adjust colors, fonts, sizes, and even add interactive features. This means your charts can not only convey information but also match your site’s aesthetic, enhancing your overall branding.
Q: Do these plugins work with all WordPress themes?
A: Generally, yes! Most chart plugins are designed to be compatible with a wide range of WordPress themes. However, it’s always a good idea to check the plugin’s documentation or user reviews to ensure compatibility with your specific theme, especially if you’re using a more niche design.
Q: What if I run into issues while using a chart plugin?
A: No worries! Most reputable chart plugins come with comprehensive support options, including documentation, FAQs, and customer service. Community forums can also be a great resource where you can find solutions from other users who might have faced similar challenges.
Q: Are there free options available, or do I need to purchase a premium plugin?
A: There are excellent free chart plugins available that can meet basic needs, but premium plugins often offer advanced features, better support, and more design options. If you’re serious about showcasing data effectively, investing in a premium plugin can be worth it in the long run!
Q: How do I get started with creating charts using these plugins?
A: Once you’ve chosen a plugin, installation is typically straightforward—just like any other WordPress plugin! After activating it, you can usually find a new menu item in your dashboard. From there, you can start creating charts by following the guided setup process. Don’t forget to experiment with different chart types and customizations to find what resonates best with your audience!
—
Feel free to dive into the article for detailed reviews of each plugin, along with step-by-step guides on creating stunning charts that will captivate your audience!
Future Outlook
Conclusion
And there you have it—11 of the best WordPress chart plugins that can truly elevate your content! Whether you’re presenting data in a blog post, enhancing a business report, or visualizing complex information, these tools will help you create stunning charts that capture attention and communicate your message effectively.
Remember, visuals are a powerful way to engage your audience. By implementing these plugins, you’re not just displaying data; you’re telling a story that resonates. So why wait? Dive into the world of beautiful charts and make your WordPress site more dynamic and informative.
If you haven’t already, give one of these plugins a try! Explore the features, play around with the settings, and watch as your data transforms into eye-catching visuals that your readers will love. Happy charting!