
In today’s digital landscape, where every click and scroll counts, understanding your website’s performance is more crucial than ever. But how do you know if your online efforts are truly paying off? Enter Key Performance Indicators, or KPIs—your essential roadmap for navigating the complex world of web analytics. Whether you’re a seasoned marketer or just starting your online journey, tracking the right KPIs can transform the way you approach your website strategy. In this article, we’ll break down what a website KPI is, why it matters, and highlight the most important metrics you should be keeping an eye on. Get ready to unlock the full potential of your website and make data-driven decisions that propel your business forward!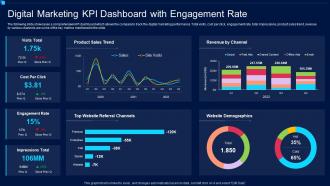
Understanding the Basics of Website KPIs
When it comes to measuring the success of your website, understanding Key Performance Indicators (KPIs) is crucial. These metrics serve as the compass guiding your online strategy, helping you pinpoint what’s working and what needs improvement. KPIs give you insights into user engagement, traffic sources, and overall performance, allowing you to make data-driven decisions.
Some essential KPIs to consider include:
- Traffic Sources: Knowing where your visitors come from (organic search, direct, social media, etc.) can help you allocate resources effectively.
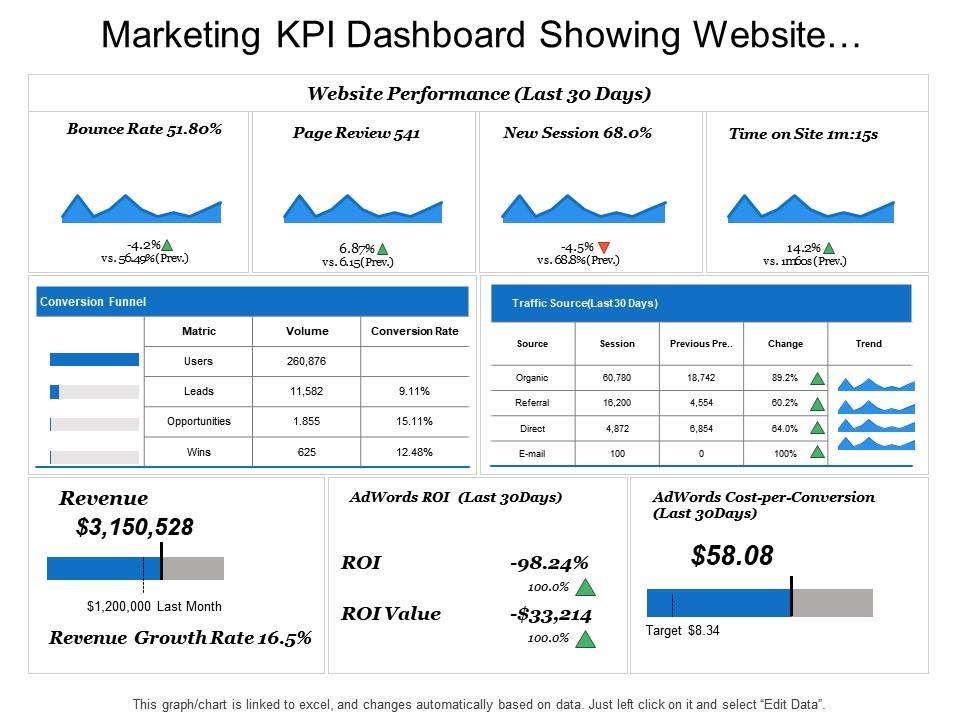
- Bounce Rate: This indicates the percentage of visitors who leave your site after viewing only one page. A high bounce rate may signal that your content isn’t engaging enough.
- Conversion Rate: This measures the percentage of users who take a desired action, such as signing up for a newsletter or making a purchase. It’s one of the most direct indicators of your website’s effectiveness.
- Average Session Duration: This shows how long visitors stay on your site, which can reflect the quality of your content and user experience.
- Pages per Session: Understanding how many pages a visitor views can help you gauge their interest and engagement with your site.
To visualize these KPIs, consider tracking them in a simple table format:
| Performance Indicator | Current Value | Goal |
|---|---|---|
| Traffic Sources | 60% Organic | 70% Organic |
| Bounce Rate | 45% | 30% |
| Conversion Rate | 2% | 5% |
| Average Session Duration | 3 minutes | 5 minutes |
| Pages per Session | 2.5 | 4 |
Monitoring these metrics regularly not only helps you track performance but also informs your marketing strategies. For example, if you notice a drop in conversion rates, it might be time to revisit your call-to-action buttons or optimize your landing pages. Regular analysis will empower you to adapt and evolve, ensuring that your website remains effective in achieving your business goals.
Ultimately, the right KPIs will vary depending on your objectives and business model. It’s essential to focus on those that align with your goals and provide actionable insights. By honing in on these key metrics, you can steer your website toward greater engagement and success.
Why Tracking KPIs Is Essential for Your Online Success
In the dynamic world of online business, the success of your website hinges on the ability to effectively measure and analyze its performance through key performance indicators (KPIs). Tracking KPIs is not just about collecting data; it’s about gaining insights that drive actionable strategies. By monitoring the right metrics, you can identify what’s working, what’s not, and where to allocate resources for maximum impact.
Understanding your audience is crucial for tailoring your content and offerings. KPIs related to user engagement, such as bounce rate, average session duration, and page views per visit, provide a window into how visitors interact with your site. High bounce rates may indicate that your content isn’t resonating, while longer session durations can signify valuable, engaging content that keeps users coming back for more.
Another key aspect of website KPIs is conversion tracking. Metrics like conversion rate, leads generated, and sales revenue allow you to measure the effectiveness of your sales funnel. By analyzing these figures, you can pinpoint where potential customers drop off and optimize those stages to enhance the user experience. Understanding the journey from visitor to customer enables you to streamline processes and improve overall performance.
Additionally, keeping an eye on traffic sources can illuminate the effectiveness of your marketing strategies. Categories to monitor include:
- Organic Search: How well your SEO efforts are paying off.
- PPC Campaigns: The return on investment for paid advertising.
- Social Media Engagement: The impact of social platforms on your audience reach.
To effectively gauge your website’s performance, consider utilizing a table format for easy reference. Here’s a simple overview of essential KPIs to track:
| KPI | Description |
|---|---|
| Bounce Rate | The percentage of visitors who leave after viewing only one page. |
| Conversion Rate | The percentage of visitors who complete a desired action on your site. |
| Average Session Duration | The average time users spend on your site during a single visit. |
| Traffic Sources | Breakdown of where your website visitors are coming from. |
In essence, the systematic tracking of KPIs fosters a culture of continuous improvement. By regularly reviewing and adjusting your strategies based on these insights, you can create a more user-centered website that not only attracts visitors but also converts them into loyal customers. Ultimately, this data-driven approach is what sets successful online ventures apart from the rest.
The Most Important KPIs Every Website Should Monitor
Tracking the right Key Performance Indicators (KPIs) is essential for understanding your website’s performance and making data-driven decisions. Here are some of the most crucial KPIs that every website owner should keep an eye on:
- Traffic Sources: Knowing where your visitors come from helps you focus on the channels that drive the most valuable traffic. Consider dividing traffic into categories like organic search, social media, direct visits, and referrals.
- Bounce Rate: This metric shows the percentage of visitors who leave your site after viewing only one page. A high bounce rate may indicate that your content isn’t engaging or relevant for your audience.
- Conversion Rate: Ultimately, the goal of your website is to convert visitors into customers or leads. Measuring the conversion rate will help you assess the effectiveness of your calls to action and overall user experience.
- Average Session Duration: This KPI provides insight into how long users stay on your site. A longer average session duration typically indicates that users find your content valuable and engaging.
- Page Load Time: In today’s fast-paced digital world, a slow website can drive users away. Monitoring page load times and optimizing your site for speed can significantly improve user experience and retention.
Additionally, it’s beneficial to analyze the top-performing pages on your site. By understanding which pages attract the most traffic and engagements, you can replicate the elements that work well. Here’s a simple table to illustrate how different pages can perform:
| Page Title | Page Views | Average Time on Page | Bounce Rate |
|---|---|---|---|
| Blog Post 1 | 1,200 | 4:30 | 35% |
| Service Page | 800 | 3:15 | 45% |
| Homepage | 2,500 | 2:10 | 50% |
Lastly, don’t forget about user engagement metrics like social shares and comments. These indicators reflect how well your audience resonates with your content and can guide you in creating future materials that are more aligned with their interests. Tracking these KPIs consistently will allow you to refine your strategies and ultimately drive more success for your website.
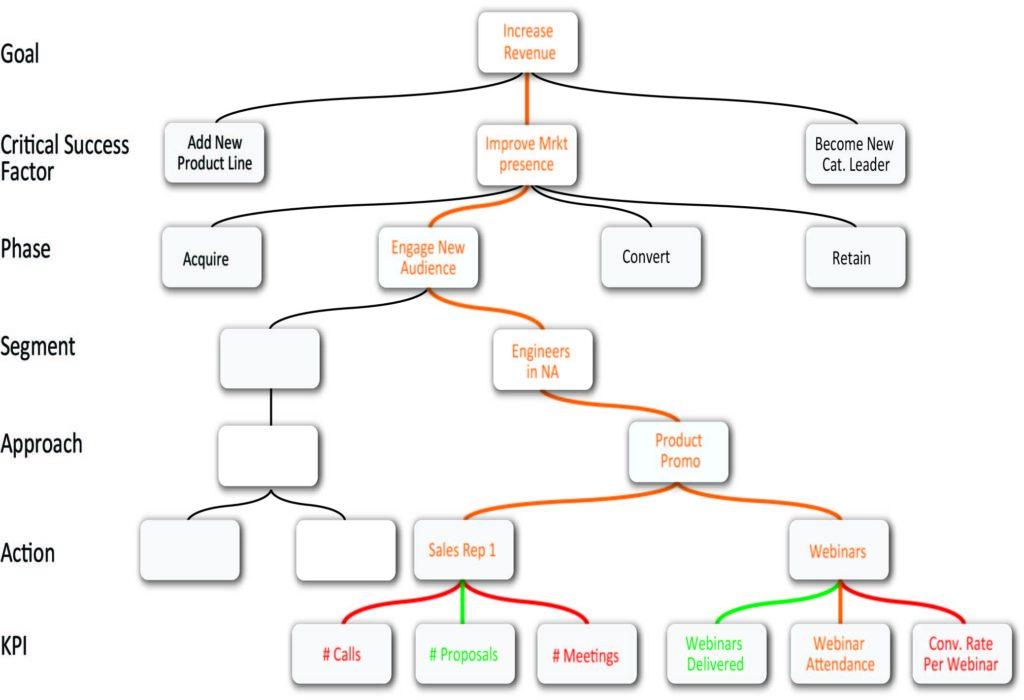
How to Align Your KPIs with Business Goals
Aligning your KPIs with your business goals is essential for ensuring that your efforts translate into tangible results. To begin with, it’s crucial to clearly define what your primary business objectives are. Are you aiming to increase revenue, enhance customer satisfaction, or boost brand awareness? Identifying these core goals will serve as a foundation for selecting relevant KPIs that accurately measure your progress.
Once your goals are established, it’s time to choose KPIs that reflect these objectives. Here are some key considerations to keep in mind:
- Relevance: Ensure that each KPI directly ties back to your business goals. For example, if your goal is to enhance customer satisfaction, you might track metrics like Net Promoter Score (NPS) or Customer Satisfaction Score (CSAT).
- Measurability: Select KPIs that provide quantifiable data. This makes it easier to track progress over time and adjust your strategies accordingly.
- Actionability: Focus on KPIs that offer insights you can act on. If a KPI indicates a problem area, having the data allows you to make informed decisions to address it.
Next, consider setting benchmarks for your KPIs. Benchmarks can be based on historical performance, industry standards, or competitive analysis. By doing so, you’ll be able to assess whether your efforts are effective in driving the desired outcomes. Here’s a simple table to illustrate how benchmarks could be laid out:
| KPI | Current Value | Target Value | Benchmark |
|---|---|---|---|
| Monthly Traffic | 10,000 visits | 15,000 visits | 12,000 visits (industry average) |
| Conversion Rate | 2% | 5% | 3% (industry average) |
| Customer Retention Rate | 80% | 90% | 85% (industry average) |
Lastly, regularly review and adjust your KPIs to ensure they continue to align with your evolving business objectives. As your company grows and market conditions change, your goals may shift, and so should your KPIs. Establish a routine for evaluating the effectiveness of your KPIs—this could be quarterly or semi-annually. A proactive approach to monitoring your KPIs will ensure they remain relevant and powerful tools in driving your business success.
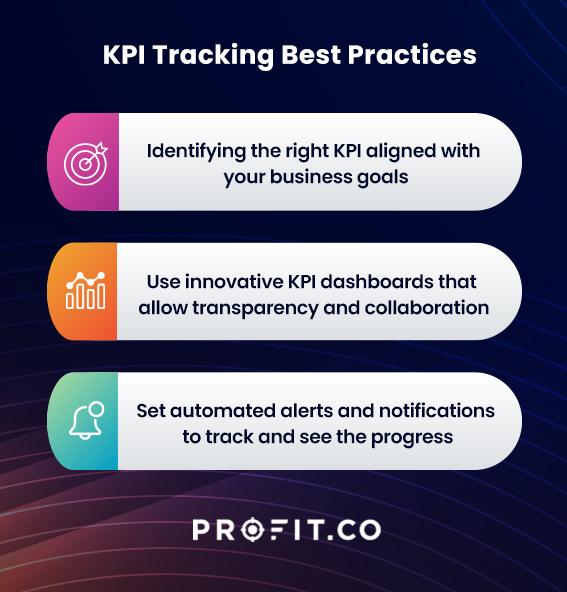
Setting Up Your KPI Tracking: Tools and Techniques
To effectively track your website performance, implementing the right tools and techniques for monitoring Key Performance Indicators (KPIs) is essential. The digital landscape is ever-evolving, and using the right resources can make all the difference in your data analysis. Here are some powerful tools you should consider:
- Google Analytics: This is the gold standard for tracking visitor behavior. With its robust features, you can monitor everything from traffic sources to user demographics, providing a comprehensive view of your audience.
- Google Search Console: Perfect for monitoring your site’s performance in search results. It offers insights on search queries, click-through rates, and indexing issues, which are crucial for SEO-focused KPIs.
- Hotjar or Crazy Egg: These tools offer heatmaps and session recordings, allowing you to visualize user interactions on your site. Understanding how users navigate can inform design and content decisions.
- SEMrush or Ahrefs: Both tools are excellent for tracking your website’s SEO performance, including keyword rankings, backlink analysis, and competitive research. They can help you refine your strategy based on real data.
Once you’ve selected the tools, the next step is to determine which KPIs are most relevant to your goals. Here are some vital KPIs to consider:
| KPI | Description |
|---|---|
| Traffic Sources | Understanding where your visitors come from helps you focus your marketing efforts. |
| Conversion Rate | Measures the effectiveness of your site in converting visitors into customers. |
| Bounce Rate | High bounce rates may indicate issues with user engagement or content relevance. |
| Average Session Duration | A longer session duration usually signifies that users find your content engaging. |
| Page Load Time | A critical factor affecting user experience and SEO rankings. |
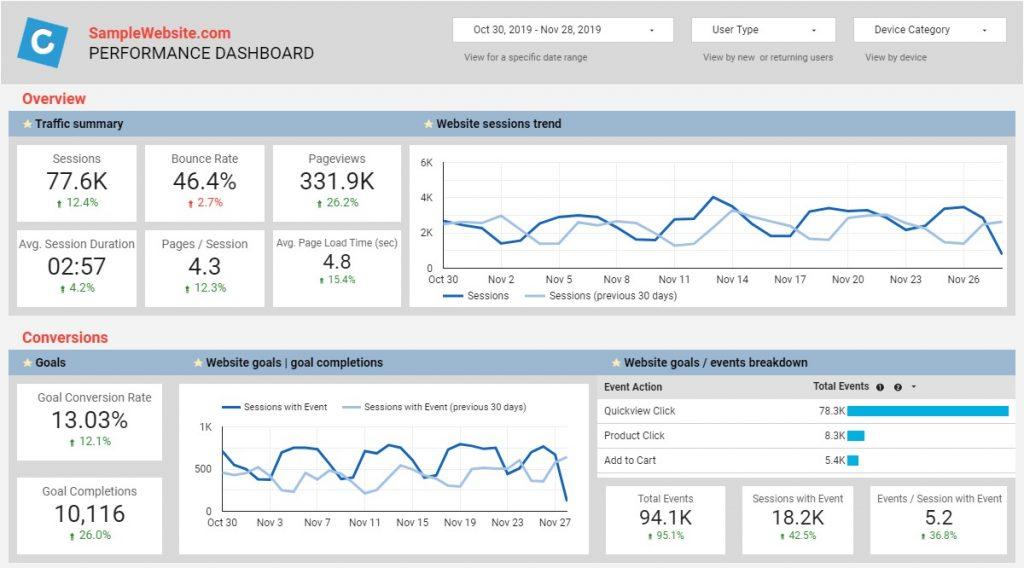
Once you’ve identified your KPIs, use your selected tools to set up dashboards that visualize these metrics over time. This allows you to quickly assess performance and make data-driven decisions. Regularly reviewing these metrics will not only help you identify trends but also adjust your strategy in real-time to optimize your website’s effectiveness.
Remember, the key to successful KPI tracking is not just about collecting data but also about interpreting it meaningfully. By combining insights from your tools and focusing on the right KPIs, you can create a website that not only attracts visitors but also converts them into loyal customers.
Interpreting Your Data: What the Numbers Really Mean
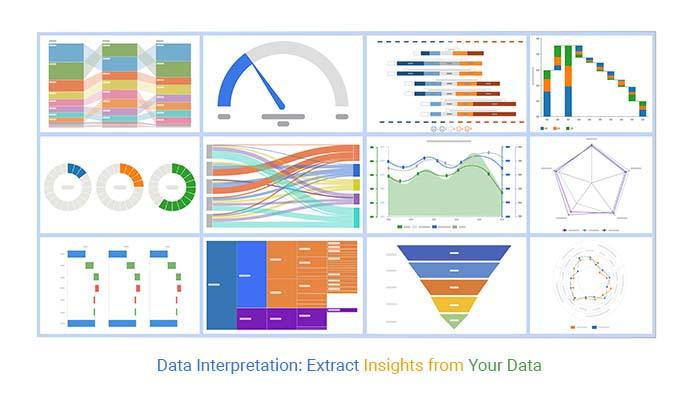
Understanding your website’s performance metrics is essential for driving growth and achieving your business goals. Key Performance Indicators (KPIs) serve as the roadmap to your online success, illuminating what’s working and what’s not. But simply collecting data isn’t enough; you need to interpret those numbers to uncover actionable insights.
When analyzing your KPIs, focus on the following crucial metrics:
- Traffic Sources: Determine where your visitors are coming from—search engines, social media, or referrals. This helps in optimizing your marketing efforts.
- Bounce Rate: A high bounce rate indicates that visitors are leaving your site without engaging. Investigate which pages are underperforming and why.
- Conversion Rate: This metric reveals the percentage of visitors who complete a desired action. A low conversion rate may point to issues with your call-to-action or landing pages.
- Average Session Duration: Longer sessions often indicate that users find your content engaging. Use this insight to enhance user experience by providing more of what interests them.
As you dive deeper into these metrics, consider using visual aids like charts and graphs. They can bring clarity to the data and highlight trends over time. Below is a simple table to illustrate the relationship between traffic sources and conversion rates:
| Traffic Source | Visitors | Conversion Rate (%) |
|---|---|---|
| Organic Search | 1200 | 5% |
| Social Media | 800 | 3% |
| Email Campaigns | 600 | 8% |
| Direct Traffic | 400 | 10% |
Remember, numbers tell a story, and it’s up to you to interpret the narrative. Are your marketing efforts yielding results? If not, what adjustments can you make? Testing different strategies, from content updates to design tweaks, can help you optimize your KPIs for better performance. By keenly observing trends and shifts in your data, you can steer your website towards greater success and engagement.
Common Mistakes to Avoid When Tracking Website KPIs
When it comes to tracking website KPIs, many businesses fall into common pitfalls that can hinder their success. One major mistake is focusing on vanity metrics rather than actionable insights. While metrics like page views and social media likes can look impressive, they don’t always correlate with conversion or engagement. It’s crucial to prioritize KPIs that genuinely reflect your website’s performance and user interactions.
Another frequent error is neglecting to set clear and measurable goals. Without specific objectives, it becomes challenging to determine whether your KPIs are truly effective. Take the time to define what success looks like for your website. For example, instead of simply aiming for increased traffic, set a goal to boost organic traffic by 30% over the next quarter. This specificity will help you focus on the right metrics and enable more strategic adjustments.
In addition, many overlook the importance of regularly reviewing and adjusting KPIs. The digital landscape is constantly changing, and what worked last year might not be relevant today. Make it a habit to reassess your KPIs every few months. This iterative approach allows you to stay aligned with business objectives and market trends. Consider using a table like the one below to organize your current KPIs and their effectiveness:
| Current KPI | Goal | Review Frequency |
|---|---|---|
| Website Traffic | Increase by 25% | Monthly |
| Conversion Rate | Achieve 5% | Quarterly |
| Bounce Rate | Reduce to under 50% | Bi-Monthly |
one of the biggest mistakes is ignoring the context behind the numbers. Data without context can be misleading. For instance, a sudden spike in traffic might look great at first glance, but if it comes from a referral that doesn’t match your target audience, it may not lead to meaningful engagement. Always analyze the data in relation to your overall strategy and user behavior to gain deeper insights into performance.
Avoiding these common mistakes can elevate your website’s performance and ensure that your KPI tracking is both effective and insightful. By focusing on meaningful metrics, setting clear goals, regularly reviewing your progress, and understanding the context behind your data, you’ll be better equipped to drive your business forward.
Using KPIs to Drive Continuous Improvement
Key Performance Indicators (KPIs) serve as the compass for your website’s performance, guiding your strategy towards continuous improvement. By regularly monitoring these metrics, you can pinpoint areas of success and those needing enhancement. KPIs not only provide insight into user behavior but also inform your decision-making process, ensuring that every change you implement is data-driven.
When selecting which KPIs to track, it’s essential to focus on those that align with your website’s goals. Here are some crucial KPIs to consider:
- Traffic Sources: Understanding where your visitors come from can help you allocate resources effectively. Keep an eye on organic, direct, and referral traffic.
- Bounce Rate: A high bounce rate may indicate that your content isn’t engaging. Aim to create more compelling landing pages.
- Conversion Rate: This metric reveals how well your site turns visitors into customers or leads. Look for ways to optimize your calls to action.
- Average Session Duration: If users spend more time on your site, it typically means they find your content valuable. Investigate methods to extend this duration.
- Page Load Time: A faster website enhances user experience and can positively impact SEO. Monitor this closely to keep visitors engaged.
To effectively utilize KPIs for continuous improvement, it’s crucial to establish a regular review process. Schedule monthly or quarterly reviews to assess your KPIs, identify trends, and make necessary adjustments. This proactive approach helps you stay ahead of the curve and adapt to changing user preferences and market dynamics.
Additionally, consider using a table to visualize your KPIs and track their changes over time:
| KPI | Current Value | Target Value | Change (%) |
|---|---|---|---|
| Traffic Sources | 2,000 visitors | 3,000 visitors | +50% |
| Bounce Rate | 45% | 30% | -33% |
| Conversion Rate | 2% | 5% | +150% |
| Average Session Duration | 3 minutes | 4 minutes | +33% |
embracing the power of KPIs will not only enhance your website’s performance but also foster a culture of continuous improvement within your team. By leveraging data effectively, you can create a more engaging and successful online experience that meets the evolving needs of your audience.
How to Adjust Your Strategy Based on KPI Insights
Understanding your Key Performance Indicators (KPIs) is crucial for tailoring your website strategy to achieve desired outcomes. Once you have collected data on various KPIs, the next step is to interpret these insights and adjust your approach accordingly. This iterative process not only enhances user experience but also boosts overall site performance.
When you notice a decline in key metrics like conversion rates or user engagement, it’s essential to delve deeper into the data. Here are a few strategies to consider:
- Content Optimization: If your bounce rate is high, assess your content for relevance and clarity. Ensure that it aligns with user intent and addresses their needs effectively.
- Traffic Sources Analysis: Identify which traffic sources are underperforming. If organic search traffic is low, it may be time to refine your SEO strategy or focus on creating high-quality backlinks.
- User Journey Mapping: Understand the path users take on your site. If users frequently drop off at a specific page, this may indicate a need for improved navigation or more compelling call-to-action buttons.
Moreover, regularly reviewing KPIs allows you to pivot your strategy based on real-time data. Implement A/B testing to evaluate changes and see how they affect KPIs. For instance, you might experiment with different headlines, layouts, or offers to see what resonates more with your audience.
In addition, consider creating a visual representation of your KPI trends. A simple table can help you monitor changes over time, making it easier to spot patterns and draw actionable conclusions.
| KPI | Current Value | Previous Value | Change (%) |
|---|---|---|---|
| Conversion Rate | 3.2% | 2.8% | +14.3% |
| Bounce Rate | 45% | 50% | -10% |
| Average Session Duration | 3:45 | 3:10 | +18.1% |
By actively engaging with your KPI data, you can tailor your website strategy over time, ensuring that it remains effective and aligned with your business goals. Remember, the key is not just to track KPIs but to make informed adjustments that lead to meaningful improvements.
Future-Proofing Your Website Performance with KPIs
As digital landscapes evolve, ensuring your website remains competitive requires a keen focus on performance metrics. Key Performance Indicators (KPIs) serve as your compass, guiding your strategy and helping you stay ahead of the curve. By tracking the right KPIs, you can identify areas needing improvement, optimize user experience, and ultimately elevate your site’s conversion rates.
So, which KPIs should you prioritize? Here are some vital metrics worth monitoring:
- Page Load Time: A critical factor in user experience, a fast-loading page can significantly reduce bounce rates and encourage user engagement.
- Conversion Rate: This metric shows the percentage of visitors completing desired actions, such as making a purchase or signing up for a newsletter, helping you assess the effectiveness of your calls to action.
- Traffic Sources: Knowing where your visitors are coming from—be it organic search, social media, or referrals—can inform your marketing strategies and budget allocation.
- Bounce Rate: A high bounce rate might indicate that your content isn’t resonating with visitors, prompting you to rethink your website’s design or content strategy.
Tracking these KPIs isn’t just about numbers; it’s about understanding the story behind those metrics. By analyzing trends over time, you can anticipate user behavior and adapt your strategy proactively. For instance, if you notice a dip in conversion rates during a particular season, you can investigate potential causes and implement targeted marketing efforts to address them.
Additionally, creating a dashboard to visualize your data can enhance your decision-making process. Here’s a simple example of how you might layout your key KPIs:
| Metric | Current Value | Goal | Notes |
|---|---|---|---|
| Page Load Time | 3.5 seconds | 2 seconds | Consider optimizing images and scripts. |
| Conversion Rate | 2.5% | 5% | Test new CTAs and landing page designs. |
| Bounce Rate | 60% | 40% | Review content relevance and user flow. |
By integrating these KPIs into your website management routine, you position your site for sustained growth and resilience against future changes in the digital landscape. Embracing this data-driven approach ensures not only that you maintain current performance levels but also that you continuously innovate, ensuring a better experience for your users.
Frequently Asked Questions (FAQ)
Q&A: What Is a Website KPI and Which Ones Should I Track?
Q: What exactly is a website KPI?
A: A website KPI, or Key Performance Indicator, is a measurable value that demonstrates how effectively your website is achieving key business objectives. In simpler terms, it’s like a scorecard that tells you how well your website is doing in terms of performance, user engagement, and conversion goals. By tracking these indicators, you can make informed decisions that drive growth!
Q: Why should I care about tracking KPIs for my website?
A: If you want to succeed online, tracking KPIs is essential! They provide valuable insights into how your audience interacts with your site, helping you identify strengths and weaknesses. By understanding what works and what doesn’t, you can optimize your site, improve user experience, and ultimately boost your bottom line. Think of KPIs as your roadmap to success—without them, you might be wandering around aimlessly!
Q: Which KPIs are the most important to track?
A: While there are numerous KPIs to consider, some of the most crucial include:
- Traffic: This shows how many visitors come to your site. It’s the foundation of your online presence!
- Bounce Rate: This percentage indicates how many visitors leave after viewing only one page. A high bounce rate may suggest that visitors aren’t finding what they expect, which is a red flag!
- Conversion Rate: Perhaps the most vital KPI, this measures the percentage of visitors who complete your desired action (like signing up for a newsletter or making a purchase). Higher conversion rates mean you’re hitting the mark!
- Average Session Duration: This tells you how long visitors stay on your site. The longer they stay, the more engaged they are!
- Page Load Time: A slow website can drive visitors away. Tracking this KPI ensures that your site is performing at its best.
Q: How can I track these KPIs effectively?
A: Great question! You can use a variety of tools, like Google Analytics, to track these KPIs effortlessly. Setting up goals within these tools allows you to measure conversions and other important actions. Additionally, keep an eye on user behavior through heatmaps or session recordings to gain deeper insights into how visitors interact with your site.
Q: What should I do once I’ve gathered my KPI data?
A: Once you have your data, it’s time to analyze and act! Look for trends, identify areas needing improvement, and set benchmarks for future performance. Don’t just collect data for the sake of it—make it work for you! Create actionable strategies based on your findings and continuously test and refine your approach.
Q: Is it necessary to track all KPIs?
A: Not at all! While it can be tempting to track every possible KPI, it’s more effective to focus on those that align closely with your business goals. Prioritize KPIs that provide the most insight into your specific objectives and audience behavior. Quality over quantity, right?
Q: How often should I review my KPIs?
A: Regular reviews are key to staying on top of your website’s performance. Depending on your business model, you might want to check your KPIs weekly, monthly, or quarterly. The important thing is to make it a habit—consistent evaluation helps you spot trends and make timely adjustments.
Q: Can KPIs evolve over time?
A: Absolutely! As your business grows and changes, so will your goals and the KPIs that matter most to you. Don’t hesitate to reevaluate your KPIs periodically to ensure they align with your current objectives. Agility is essential in the fast-paced digital landscape!
In Conclusion
Tracking website KPIs is not just a good idea—it’s a necessity if you want to thrive online. By focusing on the right metrics and adapting your strategies based on insightful data, you can enhance user experience, increase engagement, and ultimately drive conversions. So, what are you waiting for? Start tracking today and watch your website soar!
Wrapping Up
As we wrap up our exploration of website KPIs, it’s clear that tracking the right metrics can make all the difference in achieving your online goals. By honing in on key performance indicators, you not only gain valuable insights into your website’s effectiveness but also empower your decision-making process. Whether you’re focused on improving user engagement, boosting conversions, or enhancing overall performance, the KPIs you choose to monitor will serve as your compass on this digital journey.
Remember, the world of online metrics can feel overwhelming at times, but you don’t have to navigate it alone. Start by identifying a few key indicators that align with your business objectives, and gradually expand your tracking as you get more comfortable with the data. The right KPIs can transform your strategy, helping you to connect more authentically with your audience and ultimately drive greater success.
So, take the leap—start tracking those KPIs today! Your website will not only thank you, but your visitors will too. Happy analyzing!